

Carrier exits stayed high in 2025. Will you be next? The freight-recession survival guide for small fleets
FTR counted just under 5,000 revocations of operating authority per month in 2025, though new authorities nearly offset them. Spot rates are recovering - but slowly. Here's the financial and operational playbook small carriers need to survive until the market turns.
Written in June 2026. Market conditions may have changed since.
Last updated: October 2026. The freight market has turned since this guide was first published; the market section below reflects the latest data.
FTR counted just under 5,000 revocations of operating authority, net of reinstatements, per month in 2025. New authorities nearly offset them, so the for-hire carrier population was largely unchanged for the year, and still well above pre-pandemic levels - but the churn underneath that headline number has been brutal for small fleets, many of them 10-truck operations that survived 2008, 2015, and COVID. The market has turned. DAT reported dry van spot linehaul rates up about 36% year over year in late August 2026. The question is whether you'll still be here to collect them.
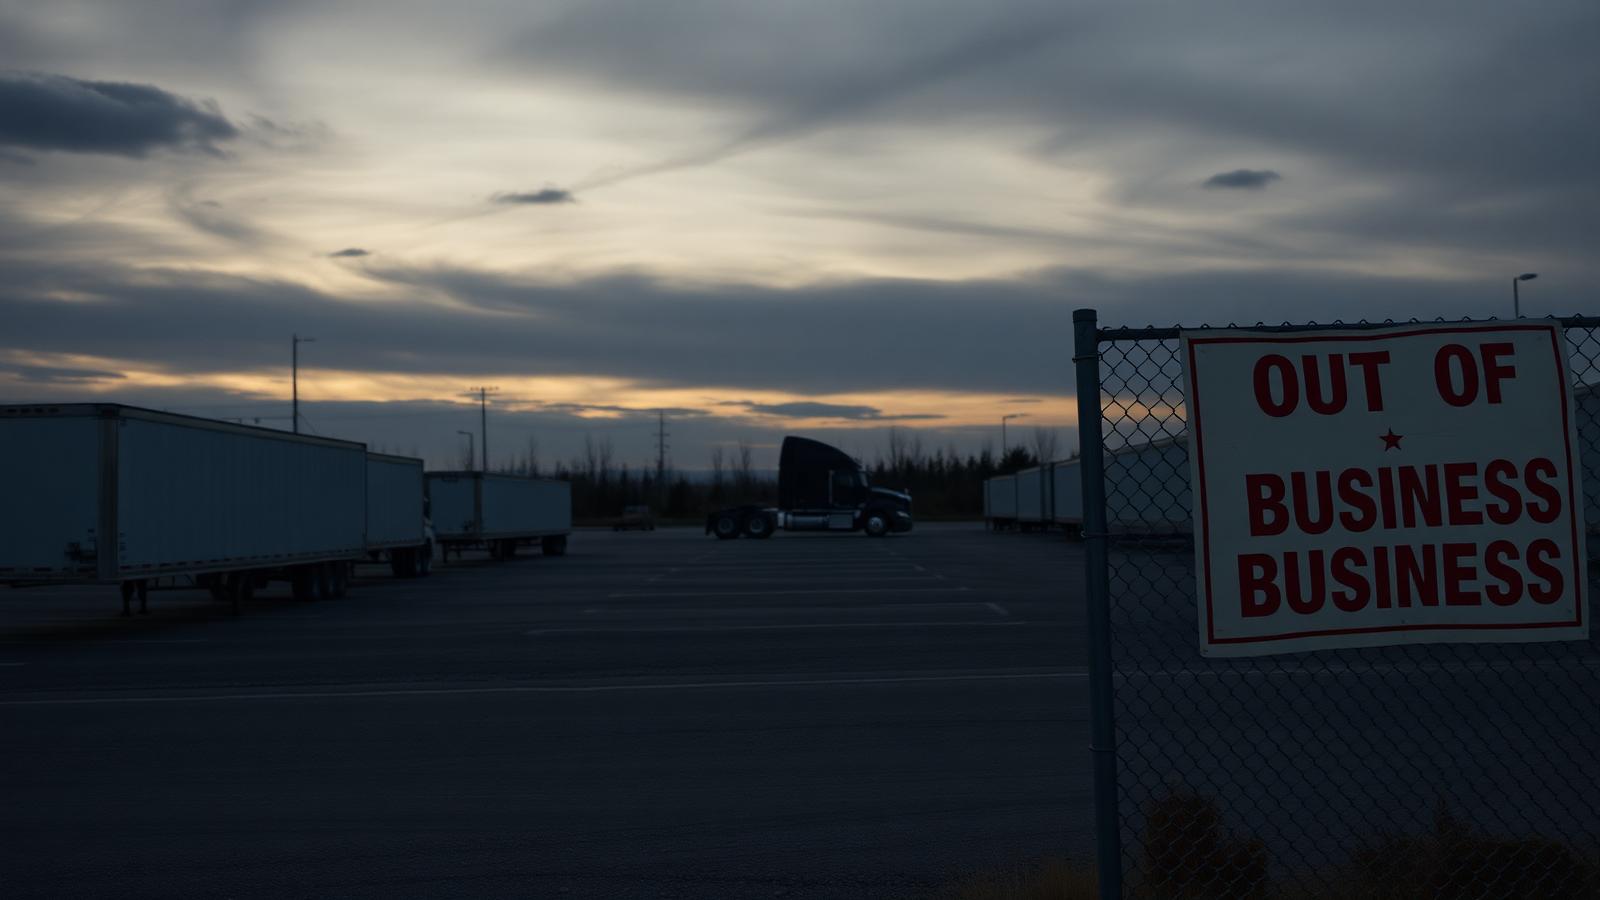
The longest freight recession in modern trucking history
It started in April 2022, when shipment volumes began their steep slide off the pandemic boom. This one just crossed the four-year mark.
The pattern was brutal: pandemic stimulus created a fake freight boom in 2020–2021 that pulled thousands of new owner-operators and small carriers into the market. Then spending rotated from goods to services, retailers cleared excess inventory, and the Fed raised rates 11 times between March 2022 and July 2023. Freight volumes collapsed. Rates followed. And because carriers had built cash reserves during the boom, they could absorb losses longer than in past cycles - which meant the capacity correction took years instead of months, grinding everyone down in the process.
DAT data shows owner-operators earned more than $1.00 per mile in gross margin during the 2020 to 2022 boom, then ran close to breakeven through 2023 to 2025.
Who shut down - and why it matters to you
The closures weren't random. They followed a clear pattern worth understanding - because it tells you exactly where the danger zones are for fleets still operating.
The pattern across closures: small asset base, significant liabilities, and a cost structure built for the 2021 market - not the 2025 one. Many were running on credit lines and factoring advances instead of real margin. When those lines tightened, there was nothing left.
Industry analysts in 2025 coined the term 'zombie carriers' - fleets running at or below break-even, kept alive by banks unwilling to take losses on equipment loans. These zombies artificially suppressed rates for everyone around them. As banks finally tighten and recognize losses, the market clears - but the cleanup itself causes more closures short-term, before rates can rise.
Know your exact break-even before you take your next load
The most common mistake in fleets that closed: they didn't know their real cost per mile. They knew fuel cost. They tracked the truck payment. But they weren't fully accounting for insurance, tires, maintenance reserves, driver pay, deadhead, and overhead - and they were taking loads below their actual break-even without realizing it.

Example: cost per mile for a small dry van fleet
The table below models one Class 8 truck running OTR. Every figure is an assumption, shown in the row label.
| Cost item | $ per mile | Notes |
|---|---|---|
| Fuel: assumed $3.85/gal at 6.5 MPG | $0.592 | Largest variable cost |
| Driver pay: assumed $0.55/mi + benefits | $0.620 | High |
| Insurance: assumed | $0.180 | Critical |
| Truck payment / depreciation: assumed | $0.145 | Fixed |
| Maintenance reserve + tires: assumed | $0.085 | Underestimated |
| Deadhead: assumed 15% empty miles | $0.095 | Reducible |
| Overhead (permits, ELD, factoring, admin): assumed | $0.055 | Fixed |
| Total cost per mile (example) | ~$1.77 | Critical |
| Revenue per loaded mile: assumed | ~$2.08 | Assumption |
| Margin per loaded mile (example) | ~$0.31 | Thin |
Illustrative example based on the assumptions shown. Your numbers will differ.
For comparison, ATRI's industry average operating cost was $2.336 per mile in 2025.
In this example, that $0.31/mi margin sounds workable - until you factor in downtime, a bad spot-market month, or one major repair. Carriers surviving now know their number to two decimals and refuse to run below it.
The market is turning - but not fast enough to relax
Here's the good news, plainly stated: the worst of the freight recession is probably behind us.
DAT reported dry van spot linehaul rates up about 36% year over year in late August 2026. FreightWaves SONAR's tender rejection rate, a key measure of carrier negotiating power, has stayed above 13% in 2026, far higher than in the previous three years. That means carriers are rejecting loads more often, which means capacity is tightening.
The bad news: 'recovery' in the second half of 2026 doesn't mean a return to 2021. It means rates normalize at levels where disciplined, low-cost operators make money. Carriers still carrying boom-era cost structures - or the ones who haven't done the hard work of renegotiating financing, insurance, and route strategy - won't feel the recovery even when it arrives.
Every analyst forecast for an H2 2026 rate recovery comes with a caveat: it assumes no major economic shock. A new tariff escalation, a financial crisis, or a significant demand drop could push the recovery timeline into 2027. You can't plan assuming recovery arrives on schedule.
The 7-point survival checklist for small fleets in H2 2026
These are the specific actions separating fleets that will be operating in 2027 from the ones that won't. Not general advice - operational decisions with measurable impact.
Calculate and write down your real break-even rate - today
Use the cost breakdown above as a starting point. Customize it for your equipment, your lanes, and your financing. Then set a hard floor: you do not haul below this number, ever, regardless of how empty the load board looks. Every load below break-even accelerates your exit.
Renegotiate your insurance - aggressively
Commercial truck insurance hit record highs in 2025 and hasn't fully retreated. If you haven't shopped competitive quotes in the last 12 months with your current safety record, you're almost certainly overpaying. A $200/month-per-truck reduction is $2,400/year per unit - real margin at these rates.
Extend equipment life - don't buy new equipment now
New truck prices remain elevated, especially with tariffs on imported components. Postpone equipment purchases and put that cash into maintenance reserves. A high-mileage truck you own outright is safer than a new truck with a $3,500/month payment at current rates.
Build 60 days of operating cash - before you need it
Most carriers that closed in 2025 and early 2026 did so because they ran out of cash during a slow period, not because their business model was fundamentally broken. In this market, we'd say: 60 days of fixed costs is the number to hit.
Cut deadhead below 12%
Many carriers run 15% or more empty miles. For example, getting to 12% on a 10,000-mile month saves 300 loaded miles of cost - at the example's $1.77/mi that's $531/truck/month recovered without booking a single extra load. Hitting it means using better lane-matching tools, building direct shipper relationships, and being willing to reposition strategically instead of chasing the next available load.
Lock at least 40% of revenue in contract freight
Carriers who survived the recession with margins intact did so because they had contract business cushioning the spot-market swings. Spot-only operations are high-risk in any market; in a recovering market, it also means you benefit last when rates improve - brokers and shippers lock in their favorite carriers first. Start building direct shipper relationships now, before the H2 rate improvement makes it a sellers' market again.
Make your fleet visible to the loads that pay
When rates improve, shippers and brokers don't try harder to find carriers - they call the ones they already know and trust. If your carrier profile, your website, and your online presence don't clearly communicate your equipment, your lanes, your safety score, and your reliability, you're invisible to the freight that pays a premium. This is the work to do now, before the market tightens.
The opportunity hidden inside the closure wave
Here's the counterintuitive truth about what's happening right now: the churn of carriers exiting and new authorities entering is part of the precondition for the rate recovery. Every truck that exits and isn't immediately replaced is one less truck chasing the same loads. The trucking market is finally showing signs of turning - mostly because capacity is tightening at the margins, not because demand is booming.
Carriers that survive Q2 and Q3 of 2026 will face a fundamentally different market in Q4 and into 2027: fewer competitors, tighter capacity, and shipper freight that has to move regardless of who hauls it. The leverage shifts. Carriers that survived the recession - battle-tested, lean, and positioned - are the ones who'll negotiate the better contracts in that environment.
Survival isn't just about not shutting down. It's about being positioned to win when the tide turns.
Tender rejections holding well above their 2023 to 2025 levels are the clearest signal that carrier leverage has returned, and in 2026 they have. That's when contract-rate renegotiation becomes realistic and locking in longer-term shipper relationships pays the most. Track this number weekly on FreightWaves SONAR.
FreightWaves (June 2026 carrier-bankruptcy reporting and small-carrier wave coverage); altLINE/SobanCo trucking-bankruptcy tracker 2025–2026; Summar Financial - Freight Industry Outlook 2026; Cox Fleet - The Freight Recession in 2026; OTR Solutions - Freight Recession 2026 Update; eCapital - Trucking Industry Trends 2026; IFA Commercial Factor - Carrier & Broker Failures 2024–2025; American Truckers LLC - 2026 Freight Market Outlook; TrueNorth - Forecasting North American Trucking Freight Rates 2026.
Position your fleet to win before the market turns. We'll show you exactly where your cost structure, your contract mix, and your online visibility stack up against carriers that are pulling ahead in H2 2026 - and what to fix first.
See how TruckyOS replaces spreadsheets and disconnected portals.
Dispatch, billing, driver records and compliance tracking in a single platform built for small and mid-size carriers.